(1) Summary of gene expression datasets incorporated in this study
| Study | Cell Type | HIV Strain/Vector | Treatment | Time Points | Latency Model | Number of Subjects | GEO |
|---|---|---|---|---|---|---|---|
| Mohammadi et al., 2014 | Primary human CD4+ T Cells | - | DMSO, vorinostat, disulfiram, 5'-azacytidine, IL-1,TCR | - | Primary | - | - |
| Iglesias-Ussel et al., 2013 | Primary human CD4+ T Cells | HIV-1 IIIB | - | - | generated in vitro from primary CD4+ T cells | validated with 4 healthy, 6 infected | GSE40550 |
| Imbeault et al., 2012 | Primary human CD4+ T Cells | NL4-3 BAL-IRES-HAS | - | 24, 48, 72 h | - | - | - |
| Lefebvre et al., 2011 | SUP-T1 cell line | pNL4-3 ΔEnv-eGFP + pMD.G, encoding the vesicular stomatitis virus G envelope protein | - | 24 h | - | - | - |
| Li et al., 2013 | Human Inguinal Lymph node biopsies | - | - | - | - | 5 uninfected, 22 untreated HIV-1 infected | GSE16363 |
| Chang et al., 2011 | SUP-T1 cell line | HIV-1 LAI | - | 12, 24 hpi (hours post-infection) | - | - | - |
| Sherrill-Mix et al., 2015 | Primary human CD4+ T Cells | HIV 89.6 | - | 48 hpi | - | - | - |
| Rotger et al., 2010 | Primary human CD4+ T Cells | - | - | - | - | 182 HIV-1 seroconverters, 16 elite controllers and 3 healthy | - |
| Navare et al., 2012 | SUP-T1 cell line | HIV-1 LAI | - | 4, 8, 20 hpi | - | - | - |
| Greenwood et al., 2016 | Activated (CD3/CD28) Primary human CD4+ T cells infected with pNL4-3-dE-EGFP | NL4-3-dE-EGFP HIV | - | 6, 24, 48, 72 h | - | - | ProteomeXchange PXD004187 |
| Jager et al., 2012 | 18 HIV-SF clones | - | - | - | - | - | - |
| Hyrcza et al., 2007 | Primary human CD4+ and CD8+ T Cells | - | - | - | - | 15 untreated HIV-1-infected individuals (early infection within 6 months, chronic progressive, nonprogressors), 5 healthy | GSE6740 |
| Smith et al., 2010 | Human Inguinal Lymph node biopsies | - | - | - | - | 22 untreated HIV-1 individuals | GSE21589 |
(2) Genes that were not mapped
Some genes could not be mapped to UniProt database for the following reasons.
These genes are listed here, and will be annotated and published after careful manual check.
(3) Genes with multiple UniProt hits
In the current database, there are several genes that can be mapped to multiple UniProt IDs. Please find the list of such genes here. The users should bear in mind that such genes with different UniProt IDs will have the same gene expression profile as we used the gene name to extract the gene expression data from the sutdies we curated in this work.
(4) Database download
The database is freely available for academic use. Please click here to download the database tables in .csv format.
(5) Search database with IDs
Searching the database with IDs is straightforward and easy. We provided two types of IDs for database search, which are UniProt ID and our database ID. The database ID consists of 'HIV' and 7 digits, ranging from 0000001 to 0014318, suggesting that there are in total of 14318 entries currently harboured in our database. The following two figures demonstrate how to search the database with UniProt ID and database ID. Please press the 'Example' button to show a pre-stored keyword to assist your search.


(6) Search database with keywords
We have provided a variety of keywords search options for the users, including protein/gene name, HIV-1 interaction partner, metabolic pathway, gene expression level during HIV latency, and drug-protein interaction as shown in the following figure.
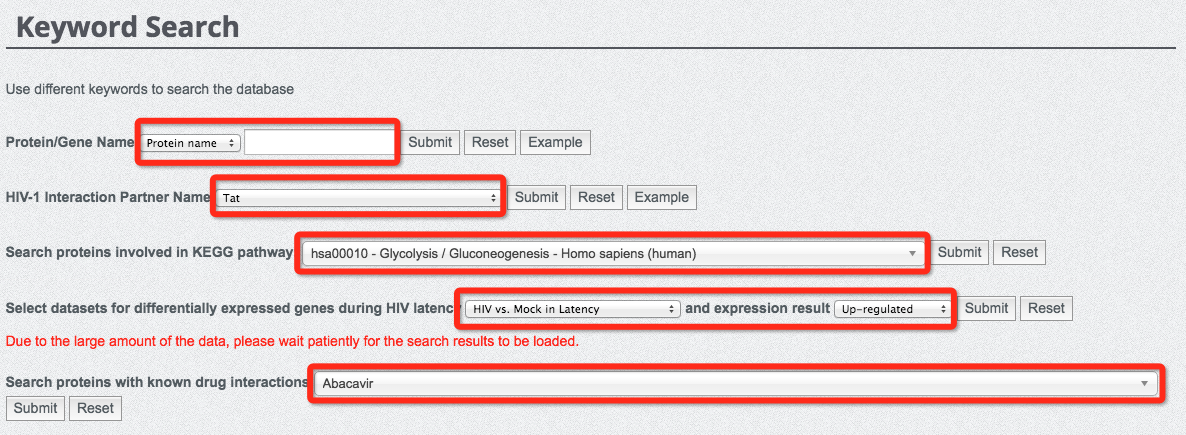
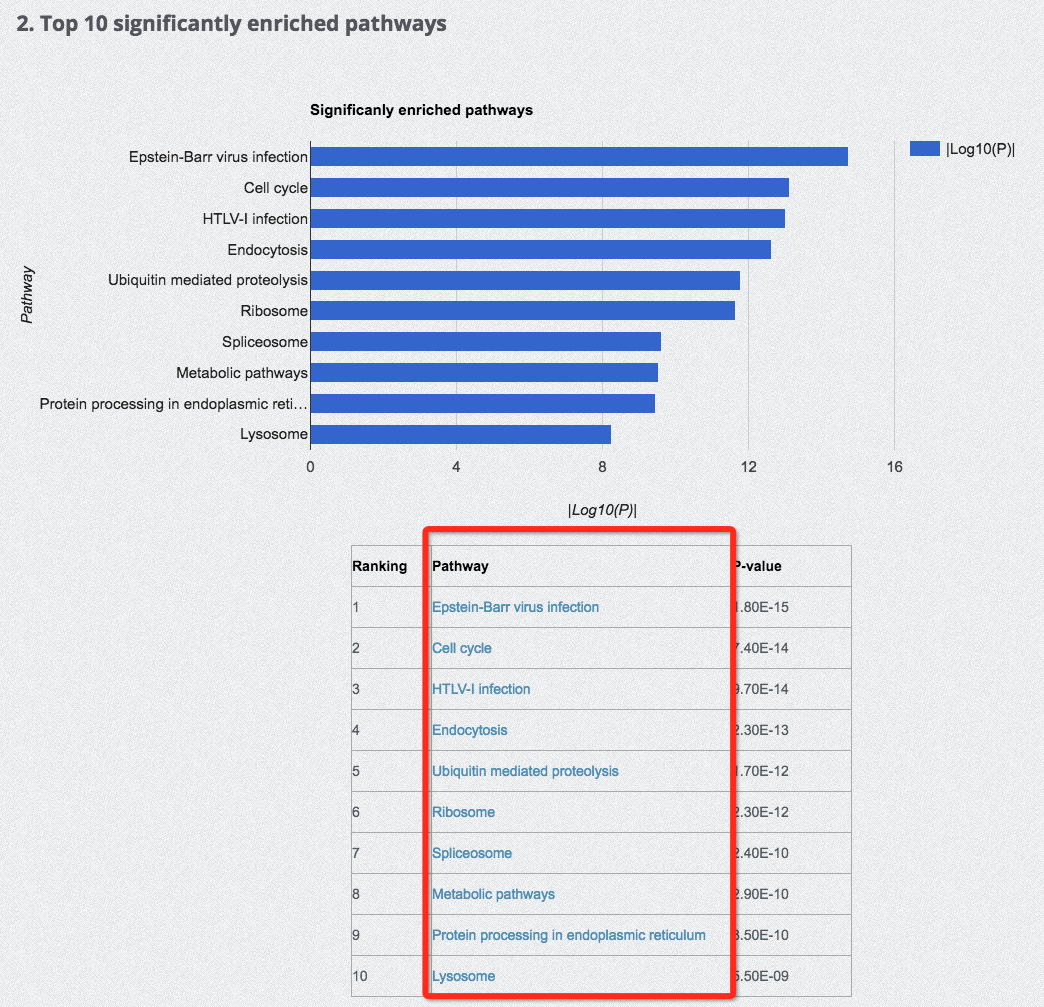
It is important to note that, due to the large amount of data stored in our database, the search with different gene expression studies during HIV latency could be a bit slower. Please wait patiently for the search results to load. In particular, we have listed the top 10 significantly enriched pathways (see the following figure and Statistics page). Interested users can directly click the hyperlinks of the listed top 10 pathways to search for the database entries directly.
(7) Browse the database
For each entry, database ID, gene name and protein name are shown to users for further invesitgation. Please click the database ID to explore the detailed annotations for the current protein entry.
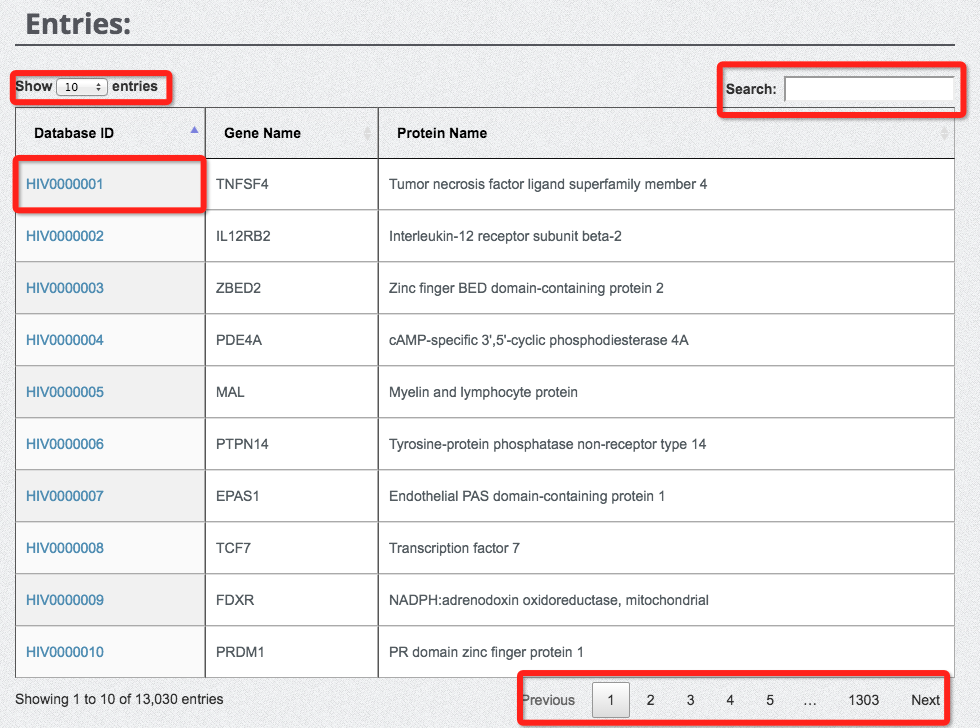
You can use the 'Search' function to fast locate the entry with your keyword.
(8) Overview of a protein
We adopted a third-party Java plug-in to implement the overview of every protein entry harboured in our database. This plug-in allows users to have a contextual view of the protein in terms of functional domains/sites and structural information.
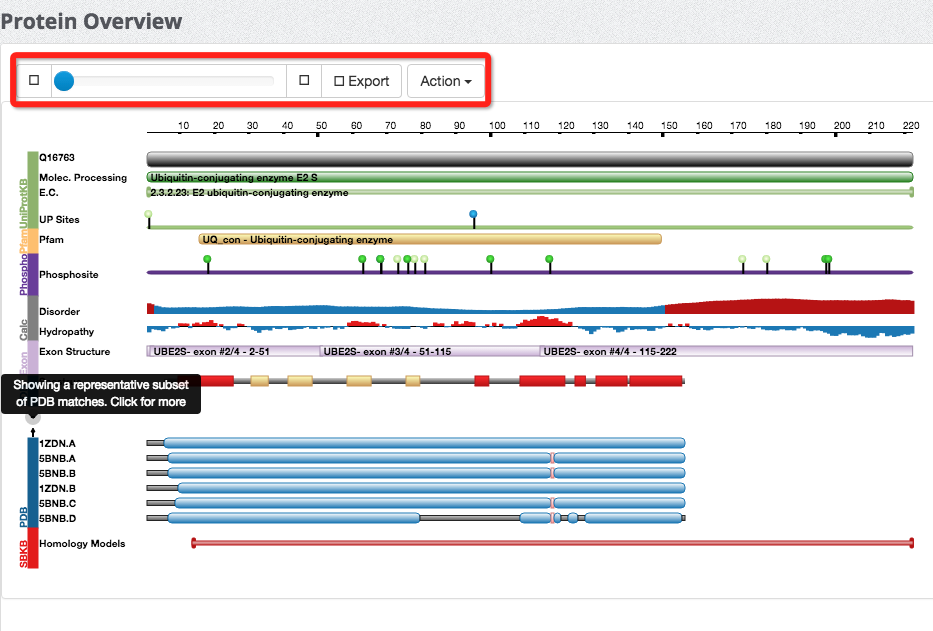
(9) Explore protein secondary structures
We cross-referenced the Protein Data Bank for protein secondary structure information. The table below is an example, where the users can have a general idea about the protein structure.
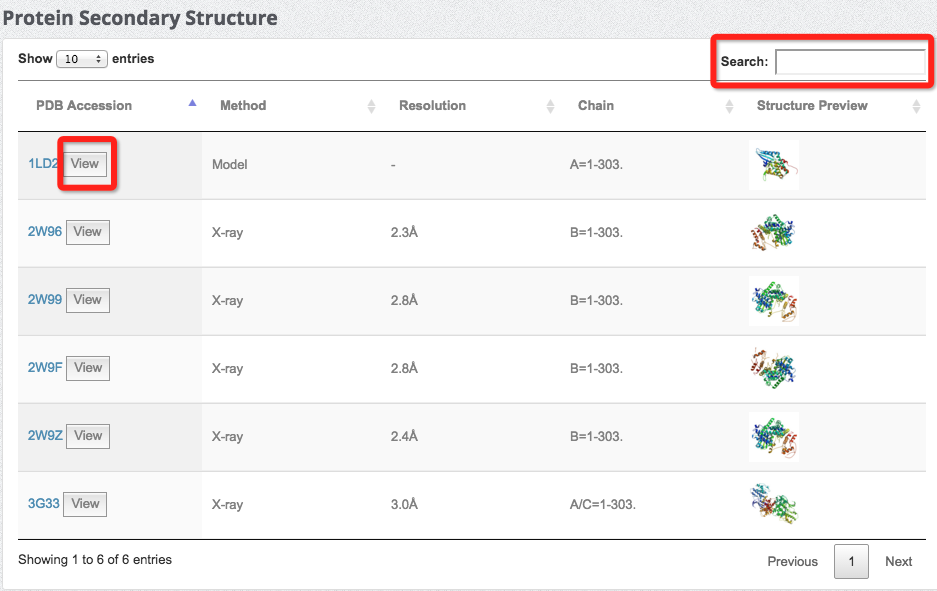
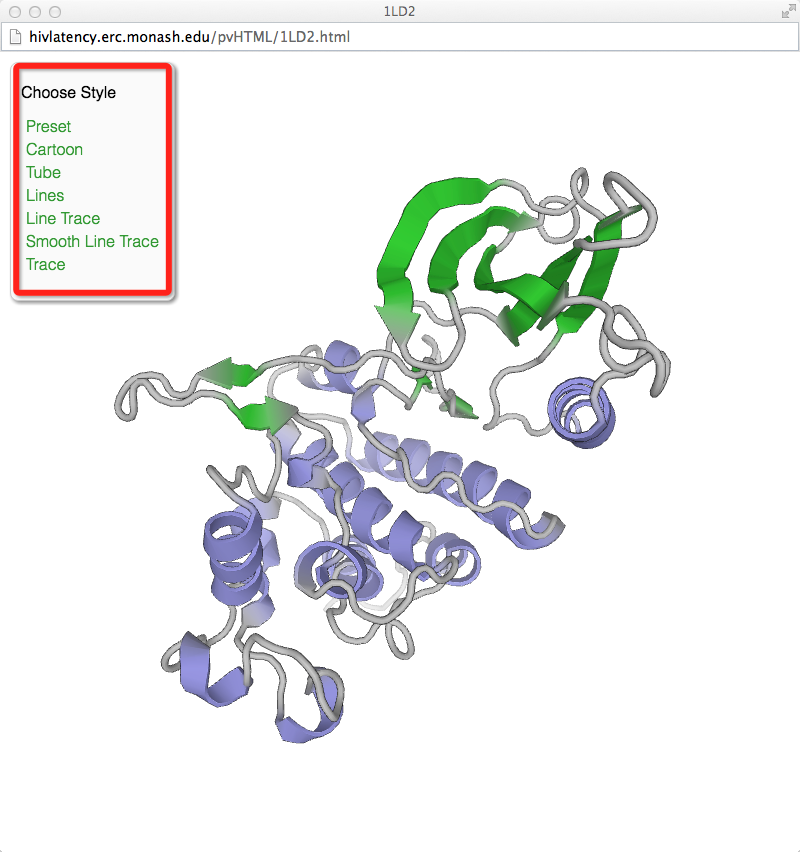
For each structure listed in the table, click the 'View' button to view the structure in detail.
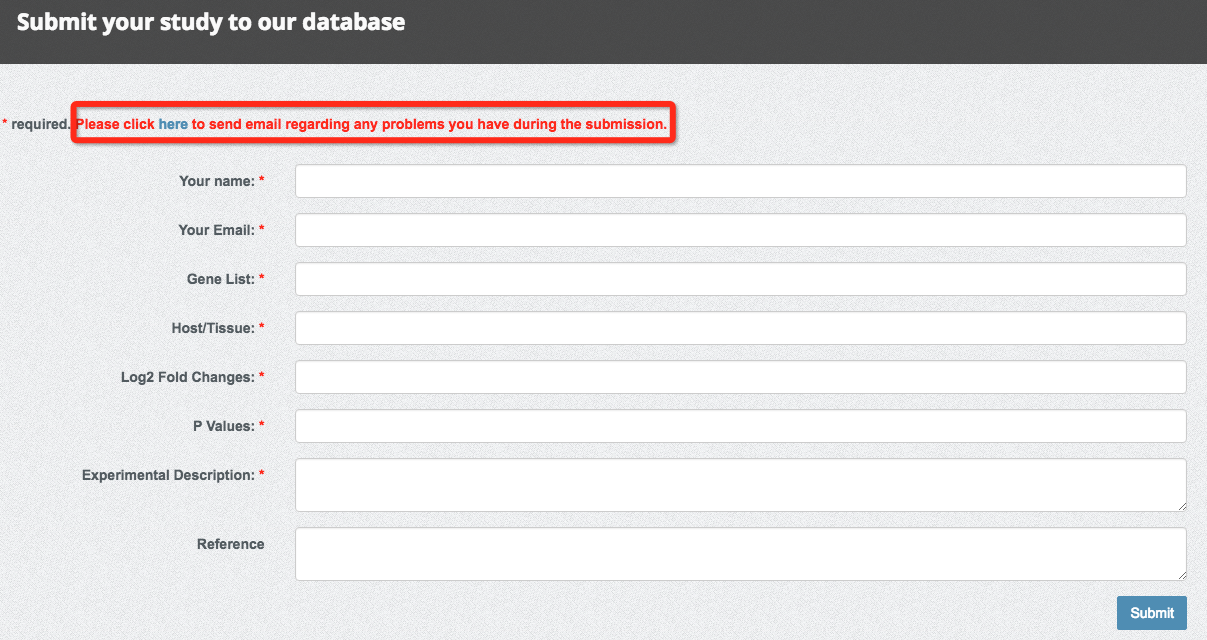
(10) Submission of new data
We invite scientists all around the world to submit their gene expression studies during HIV latency to help this database evolve. The submission webpage is shown as follows. Users can send emails to the administrator of our database if encountering any problems (showing in the figure).
